62 Practice: Ratio Visualizer
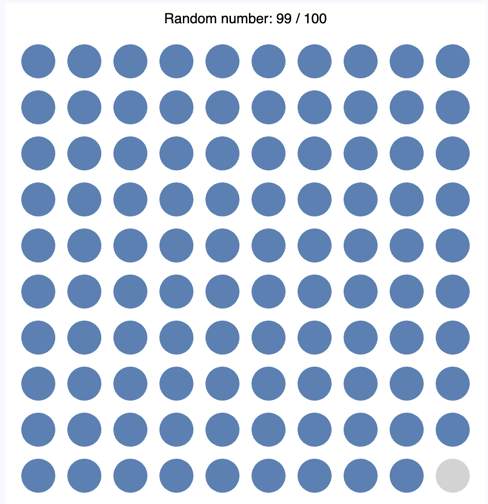
A progress bar shows a share as a single filled strip. The Ratio Visualizer shows the same idea in two dimensions. A random number between 0 and 100 decides how many of 100 circles are colored, and you build the picture out of two small functions that you design yourself. Nothing in this chapter is new, which is exactly the point. This is practice, and the only question is whether the tools of this part are already yours.
62.1 AI tutor
You have everything you need for this chapter, so work on your own first and give yourself time to be stuck. If a circle ends up in the wrong place or the wrong ones turn blue, describe to the tutor what your two functions do and what the canvas shows, and ask for a hint rather than for code.
Hints and questions instead of finished programs, in English or German.
62.2 A small team of two functions
You now design small teams of functions, and the Ratio Visualizer needs a team of two. The jobs split along a line you have seen in several chapters of this part, because one function decides and the other draws.
- The deciding function answers one yes-or-no question. Given a circle’s place in the grid and the random number, should this circle be colored? A question like that has a
booleanreturn type, and the function draws nothing at all. - The drawing function paints one single circle at the current origin, in one style when the circle is colored and in another style when it is not. It decides nothing. Somebody hands it the answer.
Two jobs, two functions. Keeping them apart pays off immediately, because you can look at a wrong picture and know where to search. If the wrong circles are blue, the deciding function is wrong. If the circles look wrong or sit in the wrong place, the drawing function or the loop around it is wrong.
The deciding function is where the real thinking happens. The circles are counted left to right and top to bottom, so the circle in the top left corner is number 0, the one next to it is number 1, and the last circle of the first row is number 9. The first circle of the second row continues at number 10. Work out on paper how a row number and a column number turn into that single counting number, then compare it with the random number. Two lines of code, one good idea.
62.3 You choose the names and parameters
The exercise does not tell you what to call your functions or which parameters they take. That freedom is the task. You met the same kind of open design in the Crossword exercise (Section 59.7), and the method that worked there works here as well. Name the job first, in plain words, then turn the name into a signature.
Ask two questions about each function. What does it need to know, and what does it hand back? Everything a function needs to know becomes a parameter, and what it hands back becomes the return type. A function that decides whether a circle is colored needs to know where the circle sits and which number it is compared against, so it takes numbers and returns a boolean. A function that draws one circle needs to know only whether that circle is colored, so it takes a boolean and returns nothing, which is : void.
Write both signatures on paper before you type them. If a signature needs five parameters, the function is probably doing two jobs and wants to be split.
62.4 Walking a grid with translate
Drawing 100 circles does not mean computing 100 pairs of coordinates. The drawing function paints at the origin, at (0, 0), and translate moves the origin between calls. A function that draws at the origin can draw anywhere, and a grid is the clearest example of that.
One row is a loop that draws and then steps to the right. The two sketches below use made-up names, drawTile for your drawing function and CELL for the distance between two neighbors:
for (let col: number = 0; col < 10; col++) {
    drawTile();
    translate(CELL, 0);
}
After that loop, the origin has wandered far to the right, which is the wrong starting point for the next row. push and pop solve it. push remembers where the origin is, and pop puts it back, so the pattern for a full grid is to push before a row, draw the row, pop after it, and then step down by one cell height:
push();
// ... the row loop from above ...
pop();
translate(0, CELL);
The outer loop repeats those four steps once per row. No coordinate arithmetic appears inside the loops, and every circle lands where it belongs.
62.5 Your exercise: Ratio Visualizer
The starter code gives you the canvas, the layout constants for the grid, the colors, and the random number. Your job is the two functions and the drawing logic in setup.
- Plan on paper. Write down the two function signatures with their names, their parameters, and their return types. Then work out the counting rule for the deciding function with a small example, for instance which circles are colored when the random number is 23.
- Write the deciding function first. It is the shorter one, and you can check it in your head before any circle exists on the canvas.
- Write the drawing function. It paints one circle at the origin and uses the given color constants. Wrap its style changes in
pushandpopso they do not leak into the rest of your program. - Fill in
setup. Show the random number as a title near the top, move the origin to the center of the first circle withtranslate, and then draw all 100 circles with the nested loop pattern from the section above. - Run it several times. The random number changes on every run, so check the border between the blue circles and the gray ones against the title. With the number 23 you should see two full blue rows and three blue circles in the third row. An off-by-one mistake shows up exactly there.
62.6 Practice on your own: Tally Visualizer

The Tally Visualizer is the same idea in a different picture, and this one you do entirely on your own. A tally chart counts in groups of five, four vertical strokes with a diagonal stroke across them, and the grid of 10 rows with 10 groups stands for 500. The two functions split the work exactly like in the Ratio Visualizer, only the deciding function now returns a number instead of a boolean, because a group can be empty, full, or anything in between. The exercise text comes in English and in German, and it offers a smaller minimum version if the full grid feels too big at first. It was a real exam in an earlier year of this course.
There is no walkthrough for this one, and there will not be one. You have everything you need. Read the task, plan your two functions on paper, and build it.