44 Silos: the array runs the show
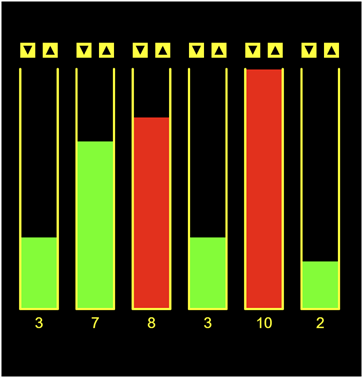
The last chapter of this part is a real little application. A factory wants a dashboard for its silos. It should show every fill level, warn in red when one runs critical, and let the operator add or remove material with buttons. Every idea of this part comes together here: the fill levels arrive as a string and are parsed into an array, the array decides how many silos exist, the mouse changes the array, and the canvas repaints whatever the array says, frame after frame. When this program runs, you have built your first interactive data application.
44.1 AI tutor
This is the largest program of the course so far, and large programs fail in small places: one wrong constant in a comparison, one forgotten flush in the parser. Build it task by task, and when something misbehaves, tell the tutor which task you are on and what the canvas shows.
Hints and questions instead of finished programs, in English or German.
44.2 From string to array
The fill levels arrive as configuration text, const INITIAL_FILL = "3,7,8,3,10,2";. You wrote a parser like this in the parsing chapter, with one difference; back then, the program drew every parsed value immediately and threw it away. Now the values must be kept, and where do parsed values live? In an array:
const silos: number[] = [];

let num: number = 0;
for (let i: number = 0; i < INITIAL_FILL.length; i++) {
    if (INITIAL_FILL[i] === ",") {
        silos.push(num);
        num = 0;
    } else {
        num = num * 10 + parseInt(INITIAL_FILL[i]);
    }
}
silos.push(num);   // the flush: the last value has no comma
The digits grow the number differently this time, with arithmetic instead of a buffer string. num * 10 + digit shifts the number one decimal place left and drops the new digit in. For "10", first 0 * 10 + 1 = 1, then 1 * 10 + 0 = 10. Recognize it? It is digit extraction from the number systems chapter, run backwards: % 10 and floor took numbers apart, * 10 + puts them back together. And the flush after the loop is your old friend from the parsing chapter, in push form.
44.3 The array runs the program
After setup, silos is [3, 7, 8, 3, 10, 2], and from that moment the array is in charge of everything in the program you are about to build:
- How many silos?
silos.length. Every loop in the program runs to that bound, so adding one number toINITIAL_FILLproduces a complete extra silo with buttons and label, with no other code change. - How full is silo i?
silos[i]. The bar height is computed from it, and its color too:silos[i] >= CRITICAL_FILLpaints red, otherwise green. - The buttons change the array, not the picture. A click on add runs
silos[i]++: writing into a single element, the last array skill this part teaches. Square brackets work on both sides of an assignment;silos[i]is a variable like any other.
The drawing itself follows the bubbles rule: draw wipes the canvas and repaints every silo from the array, sixty times a second. Nobody redraws “the changed silo”; the click changes the data, and the next frame shows the new truth automatically. That split, where events write the state and draw paints the state, is how real user interfaces work, from this dashboard up to the apps on your phone.
44.4 Derived arrays
Every silo needs an x position, and so do its two buttons. Those positions never change, so the program computes them once in setup and stores them in three more parallel arrays:
for (let i: number = 0; i < silos.length; i++) {
    const x: number = SILO_GAP + i * (SILO_WIDTH + SILO_GAP);
    silosX.push(x);
    upX.push(x);
    downX.push(x + SILO_WIDTH - BUTTON_SIZE);
}
The formula is the grid formula from the Loops part, index times (width plus gap), plus the leading gap. Arrays like these, computed from other data instead of written by hand, are called derived: silos is the real data, silosX, upX, and downX are its shadow. Computing them once in setup instead of every frame keeps draw simple; wherever a silo or button is drawn or clicked, the position is a lookup, not a calculation. The add button sits at the silo’s left edge, so upX stores the same values as silosX; the remove button leans on the right edge.
44.5 Buttons: is the mouse inside?
A button is a rectangle, and “did the click hit it?” is a question you can ask with four comparisons:
if (
    mouseX >= upX[i] &&
    mouseX <= upX[i] + BUTTON_SIZE &&
    mouseY >= BUTTON_TOP &&
    mouseY <= BUTTON_TOP + BUTTON_SIZE &&
    silos[i] < SILO_MAX
) {
    silos[i]++;
    return;
}
The first four conditions box the mouse in: right of the left edge, left of the right edge, below the top, above the bottom. All four true means the mouse is inside the button of silo i. This hit test is the standard recipe for every rectangular button you will ever build. The fifth condition is the guard rail; a full silo ignores its add button, so the level never leaves 0 to SILO_MAX.
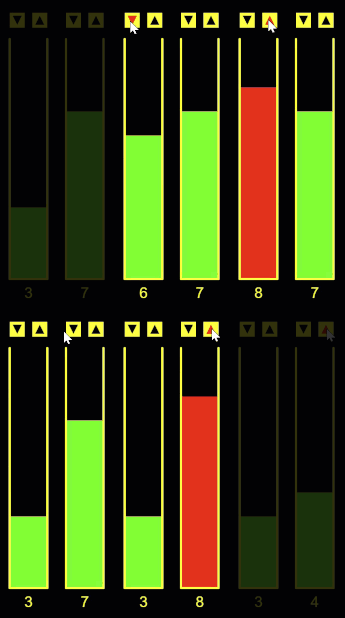
The same test runs in two places: in mouseClicked, inside a loop over all silos, to change the array, and in draw, to paint the hover highlight (the triangle turns red while the mouse sits over its button). The last new tool of the part is the bare return;, which ends mouseClicked on the spot after a hit. One click means one button; once it is found and handled, there is nothing left to check, and the return says exactly that.
If your draw translates to each silo before drawing it, remember that mouseX and mouseY always measure from the canvas corner, untouched by any translate. Hit tests must therefore compare against the stored canvas positions upX[i] and BUTTON_TOP, not against (0, 0). Mixing the two coordinate worlds is the classic hit-test bug: translate moves the pen, never the mouse.
44.6 Your exercise: Silos
The exercise page splits the work into five tasks; take them in order, and run after every one.
- Task 1: parse. Turn
INITIAL_FILLinto thesilosarray in setup (Section 44.2), and show each value withtextindraw, spaced with the grid formula. Numbers on the canvas prove the parser works before any drawing begins. - Task 2: the silos. Sketch one silo first, with the constants labeled (
SILOS_TOP,SILO_WIDTH,SILO_HEIGHT) and the bar growing from the bottom; a labeled sketch turns the drawing code into simple reading. Then draw the outline (two sides and the floor), the fill bar with its height computed fromsilos[i], the red-or-green color, and the centered number below. - Task 3: the buttons. Two yellow squares above each silo, with black triangles: pointing down into the silo on add, pointing up and away on remove. Push and pop around each button, as around every other drawing block.
- Task 4: the clicks. The hit-test loops in
mouseClicked(Section 44.5), with the guard rails for 0 andSILO_MAXand thereturnafter a hit. Click yourself through all silos: a red bar must turn green when you empty it below the critical level. - Task 5: the hover. Reuse the hit test in
drawto paint the triangle red while the mouse is over its button. Any other highlight you like works too; the sample turns the indicator red.
44.7 Check your understanding
When your dashboard clicks, clamps, and highlights, you have finished the Arrays part; the quiz below closes it. You answer six questions about this chapter in your own words, and an AI reads your answers and tells you what you already understand and what you should read again. The quiz is anonymous, and answering in German is fine too.