36 Curves from straight lines
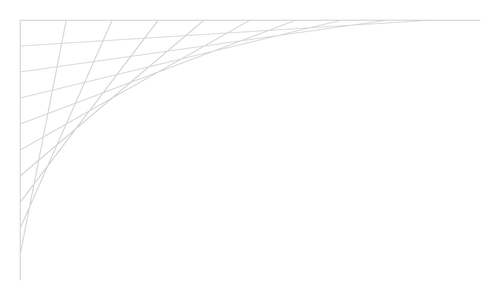
This closing chapter of the Loops part starts with a small surprise. A for loop draws straight lines, only straight lines, and a curve appears anyway. From there you give that curve its name, bend it by hand in a professional design program, let p5.js draw it with a single command, and finish with an AI that turns loops and curves into a pattern of your own. Much of this chapter follows the exercise Spaß mit Bezier-Kurven by CoderDojo Linz.
36.1 AI tutor
Curves like to go somewhere you did not expect. If your fan comes out as a box of crossing lines, or if your curve runs off the canvas instead of bending nicely, tell the tutor what you expected, what you actually see, and paste your loop or your bezier call.
Hints and questions instead of finished programs, in English or German.
36.2 A fan of straight lines
The first program of this chapter draws a fan, and every command in it is one you already know. Two line calls draw an axis to the right and an axis downward, translate moves the origin away from the canvas corner so the drawing gets some air around it, and a for loop with a typed loop variable draws the fan lines. The loop computes both endpoints of every fan line from the counter i.
This chapter has no prepared exercise, so you type the program into the Empty Playground yourself:
function setup() {
    createCanvas(500, 300);
    background("white");
    stroke("lightgray");
    translate(20, 20);

    const xWidth = 460;
    const yHeight = 260;
    line(0, 0, xWidth, 0);
    line(0, 0, 0, yHeight);

    const points = 10;
    const deltaX = xWidth / points;
    const deltaY = yHeight / points;
    for (let i: number = 1; i < points; i++) {
        line(deltaX * i, 0, 0, yHeight - (deltaY * i));
    }
}
The loop body is the interesting line. Each round connects one point on the horizontal axis with one point on the vertical axis. deltaX * i walks to the right along the horizontal axis, and yHeight - (deltaY * i) climbs upward along the vertical axis. So the first round joins a point close to the corner with a point far down, the last round joins a point far right with a point close to the corner, and in between the fan opens up.
- Type the program in. Open the Empty Playground below and write the code out. The five
constdeclarations above have no type annotations, and that is your first job: add: numberto each of them while you type, the way this course writes every declaration. Then format your code, check that there are no red squiggles, and run it. - Play with
points. The constantpointsdecides how many fan lines the loop draws. Try 5, then 20, then 50, then 100, and run after every change. - Find the curve. Every line your program draws is straight, and still a curve shows along the open edge of the fan, right where the drawn lines stop and the empty part of the canvas begins. The more lines you draw, the smoother that curve looks. No single line draws it. It appears where the lines crowd together, and each line just touches it at one spot.
36.3 The curve has a name
The curve at the edge of the fan is a Bezier curve, spoken roughly like “bay-zee-eh”. It is named after Pierre Bézier, a French engineer who worked for the car maker Renault in the 1960s. He needed a way to describe the shape of a car body exactly, precise enough for a machine to cut the metal, and these curves were his answer.
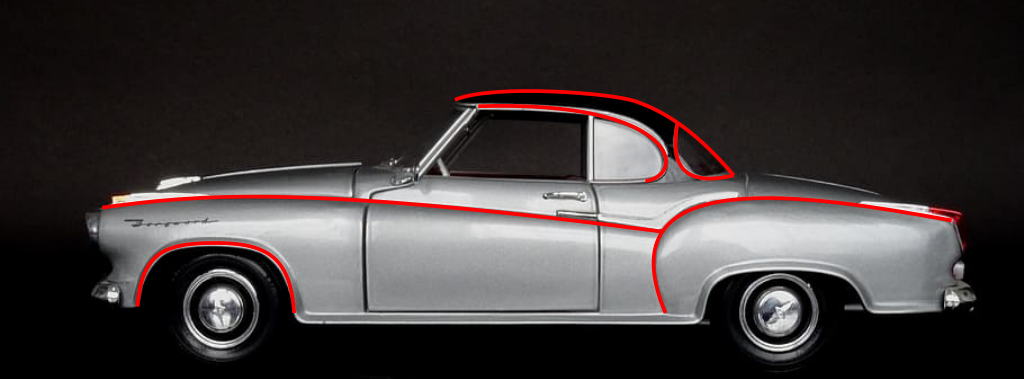
Today Bezier curves sit everywhere a smooth shape has to be stored exactly. Every letter of every font on this page is built from them, every icon on your phone, every drawing made in a vector graphics program, and many animations in games. Look at a letter with round shapes, an S or an R, and follow its outline with your eyes. Somebody once placed the points of those curves.
Three points describe your fan’s curve, and you can point at all three in your own program:
- It starts at the lower end of the vertical axis.
- It ends at the right end of the horizontal axis.
- It bends toward the corner where the two axes meet, and it never reaches that corner.
The corner is the control point of the curve. A control point pulls the curve toward itself, like a magnet, but the curve does not run through it. The straight lines of your fan are the construction lines of exactly this curve, which is why the curve showed up without anybody drawing it.
A curve with a start point, an end point, and one control point is called a quadratic Bezier curve. Give it two control points instead, one pulling near the start and one pulling near the end, and it is a cubic Bezier curve. Cubic curves can do more, an S shape for example, and most programs use them. The p5.js bezier command draws cubic curves, and so does the design program Inkscape.
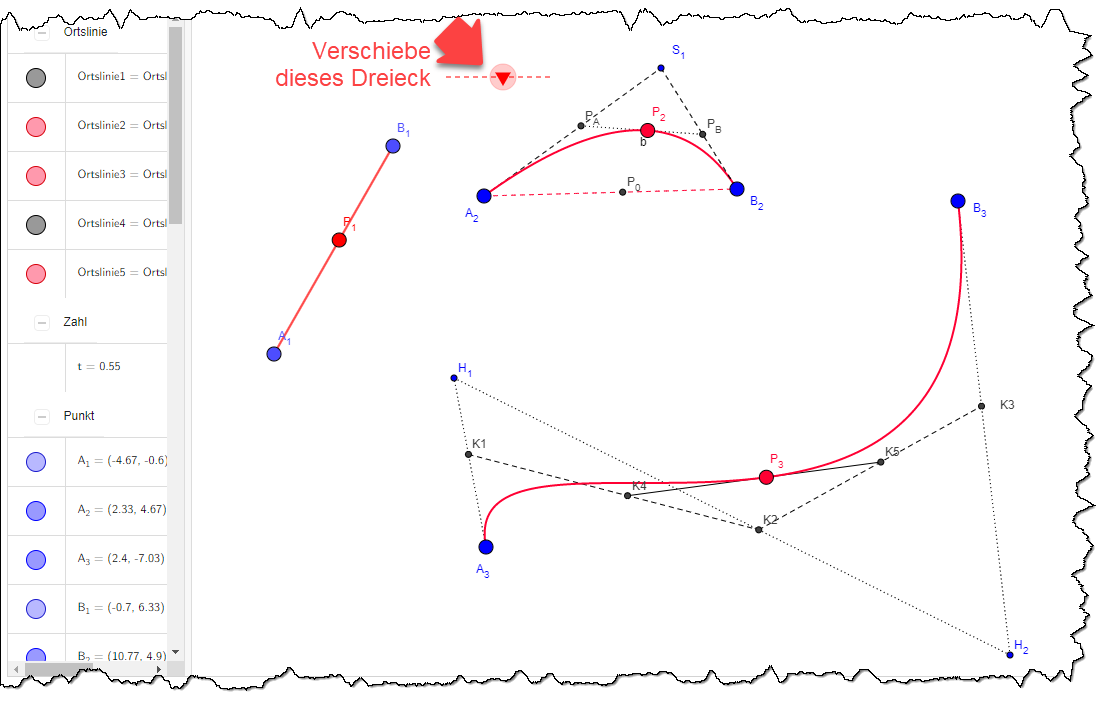
This part is voluntary, and it is the best kind of voluntary. The video The Beauty of Bézier Curves shows where the curves come from and how fonts use them. On the interactive GeoGebra page about Bezier curves you can drag the control points yourself and watch the construction lines follow.
36.4 Bending curves in Inkscape
Inkscape is a free vector graphics program that designers and software developers use for real work, and every shape you draw in it is made of Bezier curves. Get it from the Inkscape download page and install it yourself. Installing a program is a skill of its own, so this book gives you no click-by-click instructions for it. If you get stuck, that is what the AI tutor and a search engine are for.
Once Inkscape runs, play with it in four steps.
Pick the pen tool. It is also called the Bezier tool, and its icon shows a pen drawing a line.
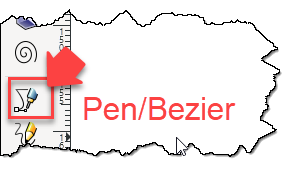
The Inkscape tool bar with the pen tool, also called the Bezier tool, marked by a red arrow. Draw a straight line. Click once for the start point, click a second time somewhere else for the end point, and press
Enter(a double click on the last point works too). You get a plain straight line.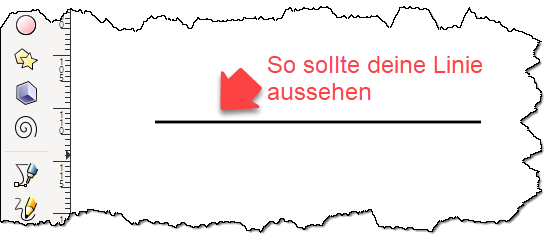
A single straight black line on the Inkscape canvas, the result of two clicks with the pen tool. The German note says that this is how your line should look. Bend the line. Switch to the node tool, the arrow at the top of the tool bar that edits points. Grab the line in the middle and drag it upward. The straight line bends into a curve while you drag.
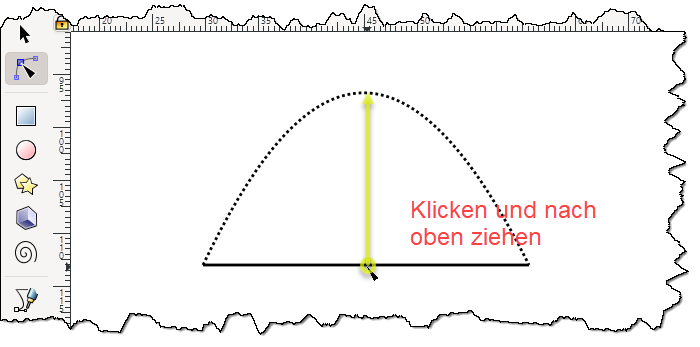
The node tool is active, and the middle of the line is being dragged upward. A dotted preview shows the arch the line is turning into. Show the handles. Click one of the two end points of your curve. Two thin lines pop out with a small circle at the end of each. Drag one of these circles and watch the curve change shape.
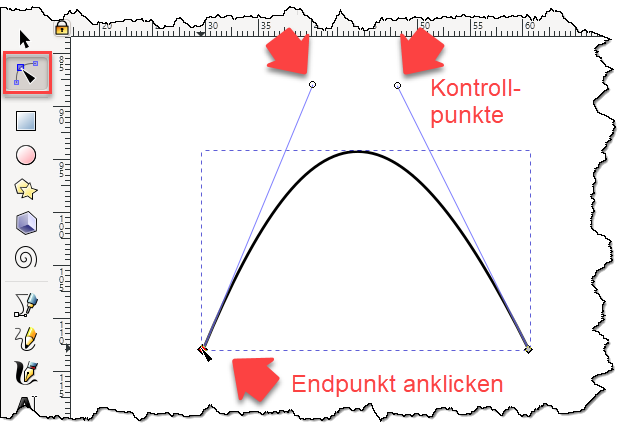
A finished arch in Inkscape. One end point is selected, and two thin handles reach up to small circles, labeled in German as the control points of the curve.
Those small circles at the ends of the handles are the control points, the very same idea as the corner in your fan. They pull the curve toward themselves, and the curve stays away from them. Two handles, two control points, so an Inkscape segment is a cubic Bezier curve.
Now take about 10 minutes of free play. Draw a heart, a wave, a fish, a mountain range, whatever needs smooth curves. YouTube is full of short tutorials about the Inkscape pen tool, and looking one up is a good move, not cheating.
36.5 The bezier command
p5.js draws Bezier curves for you with one command and eight numbers:
bezier(x1, y1, cx1, cy1, cx2, cy2, x2, y2)The eight numbers are four points in a fixed order, namely the start point, the first control point, the second control point, and the end point. Two control points means this is a cubic Bezier curve, the same kind a design program draws.
Two details matter before you type the next program. First, p5.js treats a curve like a shape: with a fill color set, it paints the area the curve encloses. noFill() switches that off, and one of the experiments below switches it back on so you can see the difference. Second, the drawing happens inside draw, so the picture is repainted every frame and the curve follows your mouse.
function setup() {
    createCanvas(510, 500);
}

function draw() {
    background("white");
    noFill();

    const upperY: number = 205 - abs(mouseY - 205);
    const lowerY: number = 205 + abs(mouseY - 205);

    stroke("red");
    strokeWeight(5);
    bezier(5, 205, mouseX, upperY, mouseX, lowerY, 505, 205);

    stroke("blue");
    circle(5, 205, 4);
    circle(505, 205, 4);
    circle(mouseX, upperY, 4);
    circle(mouseX, lowerY, 4);

    strokeWeight(1);
    line(5, 205, mouseX, upperY);
    line(505, 205, mouseX, lowerY);
}
Read the program point by point.
- The start point (5, 205) and the end point (505, 205) never move. Both sit on the same horizontal line, a little above the middle of the canvas, one near the left edge and one near the right edge.
abs(mouseY - 205)is the distance of the mouse from that line.absthrows the minus sign away, so the distance is never negative.upperYlies exactly that far above the line,lowerYthe same amount below it.- Both control points sit at
mouseX, one atupperYand one atlowerY. The two mirror each other around the line, one pulling up and one pulling down, and that mirroring is what bends the curve into an S. - The blue circles mark all four points, and the two thin blue lines connect each end of the curve with the control point that belongs to it. They are the same handles you dragged in the design program.
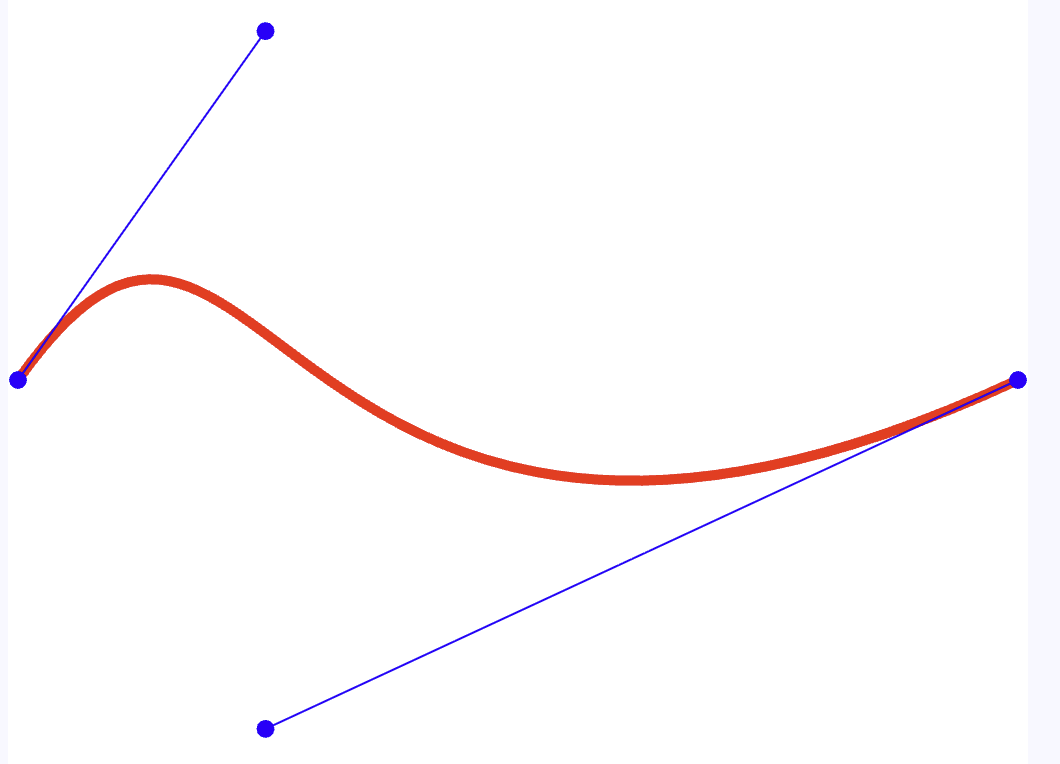
- Type it in and move the mouse. Use the Empty Playground below, either the one with your fan or a fresh one. Format, run, and then move the mouse slowly across the canvas. Watch how the curve chases the two control points without ever touching them.
- Aim at the middle line. Move the mouse until it sits on the height of the two fixed points, at y = 205. The distance becomes 0, both control points land on the line, and the curve turns into a straight line.
- Experiment. Swap
upperYandlowerYinside thebeziercall and you get an arch instead of an S. Then replace both control points with (mouseX,mouseY), so the two become one, and see the simple bow that a single control point produces. ReplacenoFill()withfill("gold")and run: the area the curve encloses gets painted, and the four little circles get a gold filling too. PutnoFill()back, then change colors and stroke weights until it looks the way you want.
36.6 Your exercise: curve patterns with an AI
This is the finale of the Loops part. You take the row recipe from the patterns chapter (Section 35.2), where an outer loop notes its position with push, an inner loop draws across, and pop brings the origin home again, and you combine it with bezier into a pattern of your own design. You will not type that program. You describe what you want and an AI writes the code, just like the animal exercise back in the first part (Section 5.4). Judging the answer and understanding it is the real work.
This AI writes code from your prompt. Describe the pattern you want, and paste your working bezier program below your description.
- Design first. Decide what should repeat before you write a word to the AI. Waves like water, roof tiles, flower petals, woven ribbons, a snake of S curves? Settle on a rough number of rows and columns and on your colors.
- Write the prompt. Describe your pattern precisely, because the AI gives you what you say, not what you mean. Say that you are a beginner and that the code you paste shows everything you have learned. Ask it to keep the structure of your playground, so p5.js and TypeScript,
setupanddraw, and explicit type annotations on every declaration. Then paste your working curve program from the section above underneath your description. - Run and iterate. Put the answer into the playground and run it. If the pattern is not what you pictured, either adjust numbers yourself or send a follow-up prompt saying what should change. Repeat until the result is worth keeping.
- Keep only what you understand. The old rule still decides. Every line you cannot explain gets asked about or thrown out. Format the finished program, and expect to show your pattern in class and explain a line or two of it.
36.7 Check your understanding
When your fan and your S curve both run, and you can say in your own words what a control point does, take the short quiz below. You answer six questions about this chapter in your own words, and an AI reads your answers and tells you what you already understand and what you should read again. The quiz is anonymous, and answering in German is fine too.